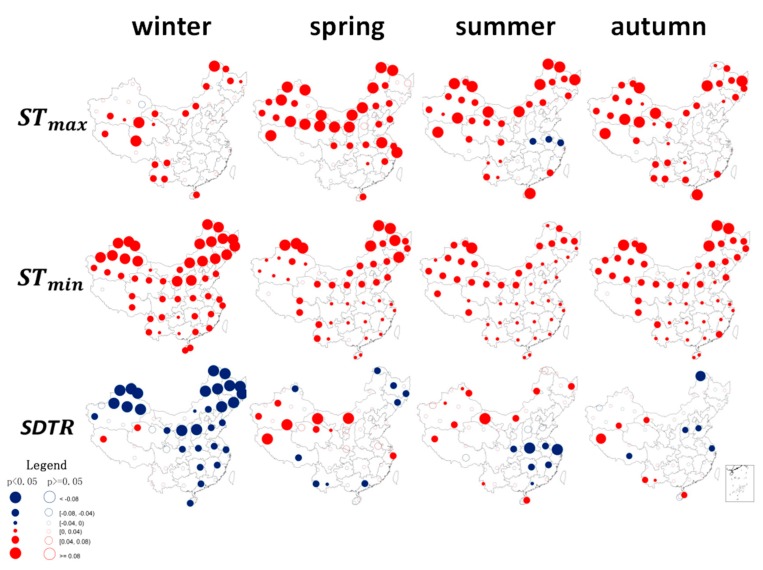
Figure 4.
Spatial and seasonal patterns of changes in soil surface temperatures (, , and SDTR) during 1962–2011 (°C/year) at 360 observational stations in China. The color of the circles indicates the magnitude of change. Solid circles with point indicate significance level of p < 0.05, whereas hollow circles are p > 0.05. Maps in this figure were created by ArcGIS 9.3 (ESRI, 2008).

