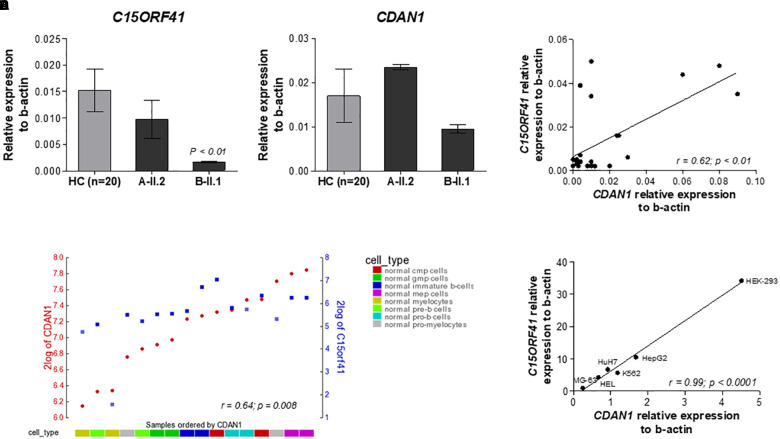
FIGURE 2.
Analysis of the C15orf41 and CDAN1 expression. (A) C15orf41 mRNA relative expression to β-actin of patients A-II.2, B-II.1, and HCs (n = 20) are shown. Data are presented as mean ± SE. P value by Student’s t-test. (B) CDAN1 mRNA relative expression to β-actin of patients A-II.2, B-II.1 and HCs (n = 20) is shown. Data are presented as mean ± SE. (C) Correlation analysis between C15orf41 and CDAN1 gene expression, performed on 20 HCs and two probands, showed a direct correlation between the two genes (Pearson correlation r = 0.62, p = 0.01). (D) YY-plot of correlation analysis performed by R2 database to investigate the expression level of C15orf41 and CDAN1 genes in the expression dataset for normal flow sorted hematopoietic cell subpopulation (GEO ID: gse19599); CMP, common myeloid progenitor; GMP, granulocyte-macrophage progenitor. Pearson correlation r = 0.64, p = 0.008. (E) Correlation analysis between C15orf41 and CDAN1 expression, performed in MG-63, HEL, K562, HuH7, HepG2, and Hek-293 cell lines. MG-63, bone osteosarcoma cells; HEL, human erythroblasts; HuH7, hepatocellular carcinoma cells; HepG2, hepatocellular carcinoma cells (Pearson correlation r = 0.99, p < 0.0001).

