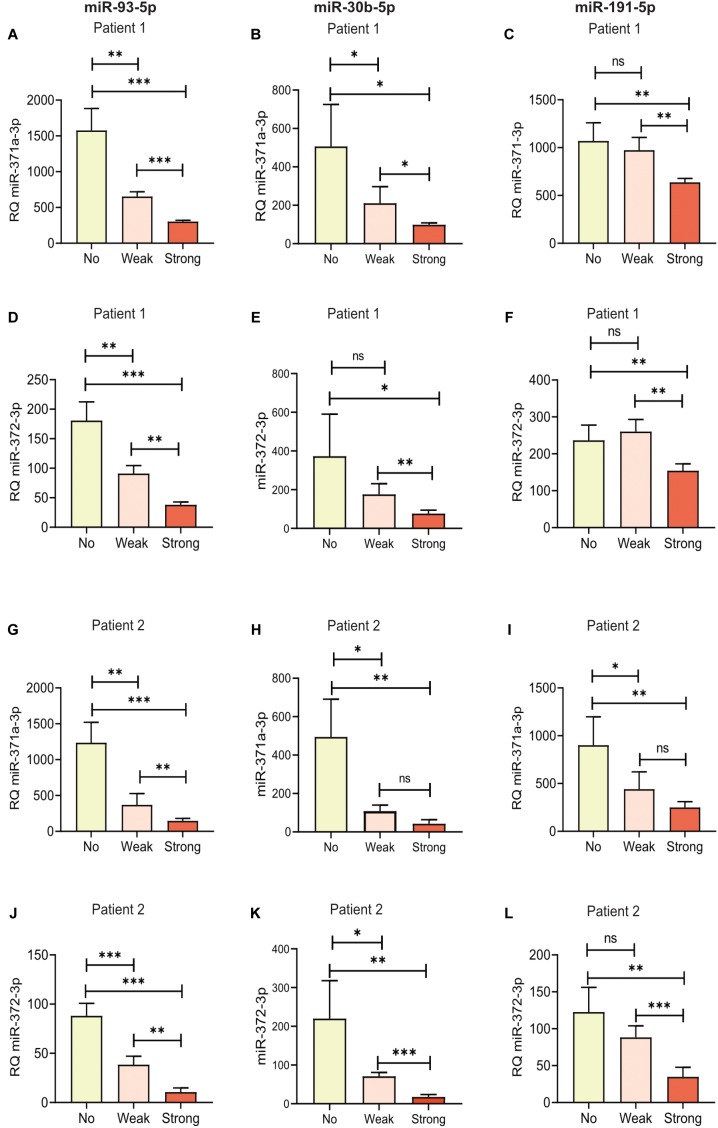
FIGURE 3.
Hemolysis affected the measured levels of specific microRNAs in serum from the two patients, Patient 1 and Patient 2. Relative quantities (RQs) representing miR-371a-3p and miR-372-3p were calculated with miR-93-5p (A,D,G,J), miR-30b-5p (B,E,H,K) and miR-191-5p (C,F,I,L) as reference genes. “No,” “Weak,” and “Strong” represent the same serum, but with 0.0, 0.05, or 0.2% added RBCs, respectively. ∗P < 0.05, ∗∗P < 0.01, ∗∗∗P < 0.001. Bars represent mean RQ with standard deviations (SD). RQ = 2-ΔΔCq.

