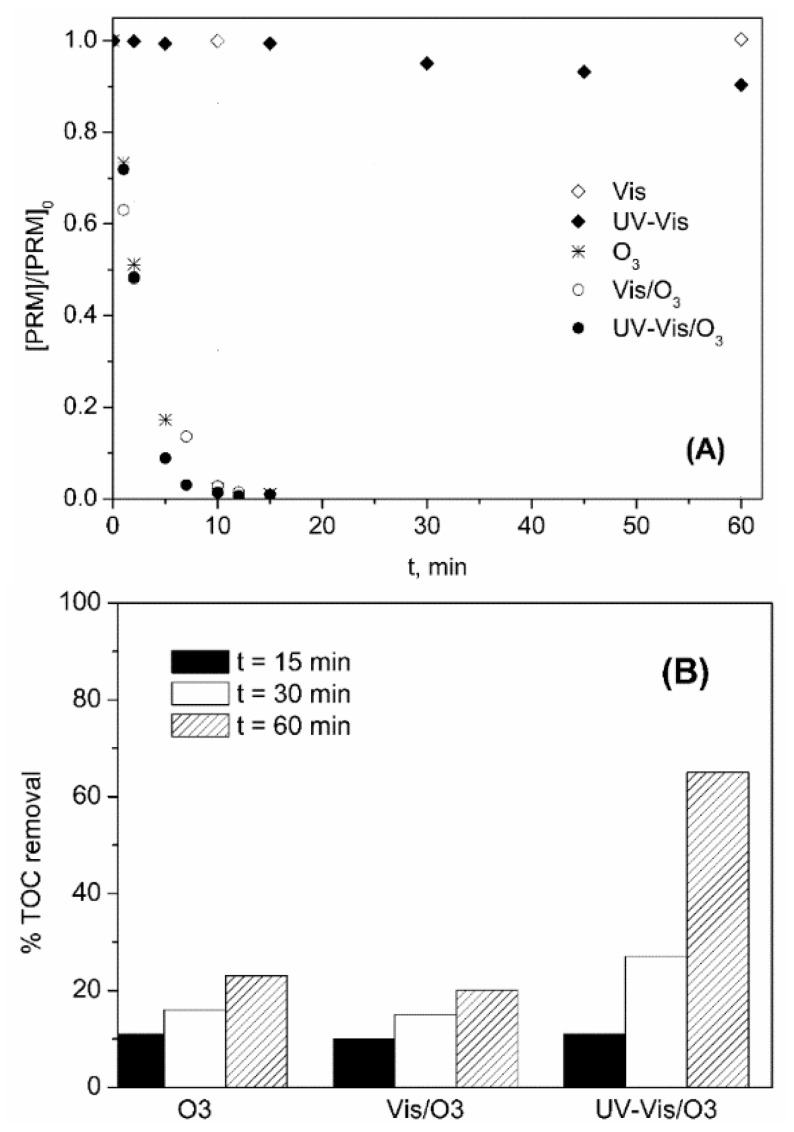
Figure 2.
Variation with time of PRM normalized concentration (A) and percentage of TOC removed (B) during the application of different processes in ultrapure water. Experimental conditions: [PRM]0 = 5 mg L−1; [TOC]0 = 3.3 mg L−1; pH0~6 (natural pH); Qm,O3 = 3.3 mg min−1; T = 20–30 °C; IVis = 7.75 × 10⁻⁵ Einstein L−1 s−1; IUV-Vis = 8.2 × 10⁻⁵ Einstein L−1 s−1.

