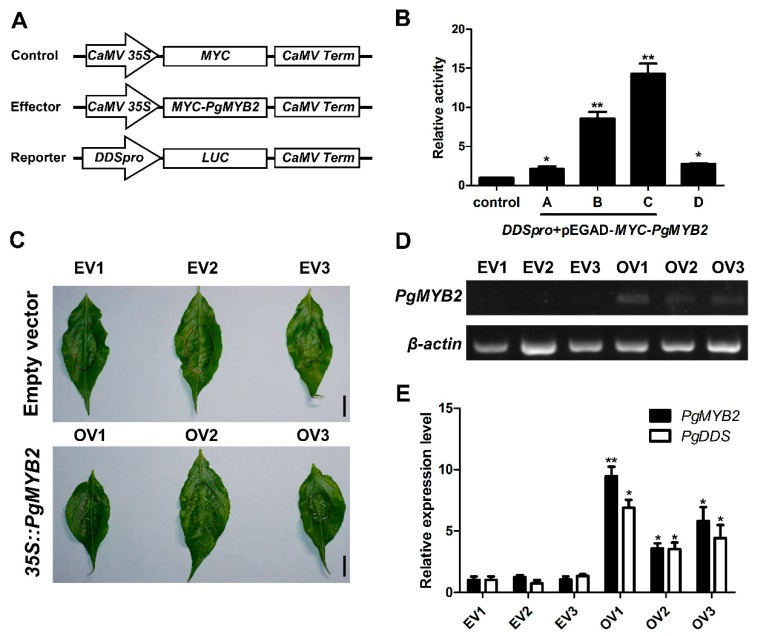
Figure 7.
Transient expression assays of PgMYB2. (A) Sketch map of reporter and effector constructs used for transient expression system. The empty vector carrying CaMV 35S::MYC was constructed as a control. The CaMV Term box indicates the terminator. (B) The relative activity of PgMYB2 in the transient expression assay. Group A–C represent for the different molar ratio (4:1, 2:1, 1:1) of reporter and effector. Group D represents the absence of MBSII in DDSpro. The relative activity of the control group was set as 1, and the relative activity of other groups was calculated according to the LUC/REN ratio. (C) The phenotype of ginseng leaves after 2 d of Agrobacterium infection. EV1-3 represent the leaves injected with empty vector, while OV1-3 were injected with the pCAMBIA1302-PgMYB2 vector. Scale bar = 1 cm. (D) RT-PCR was performed to confirm the overexpression of PgMYB2 in ginseng leaves after 2 d of Agrobacterium injection. (E) The expression levels of PgMYB2 and PgDDS in ginseng leaves were quantitatively analyzed by qRT-PCR. The related genes expression levels of the EV1 were set as control, and the expression levels of other groups were calculated according to this group. All expression levels were normalized according to the expression level of β-actin. The diagram represents the average values and error bars represent the SDs from three replicate experiments. Asterisks indicated a significant difference between the EV1 and experimental groups, * p < 0.05, ** p < 0.01.

