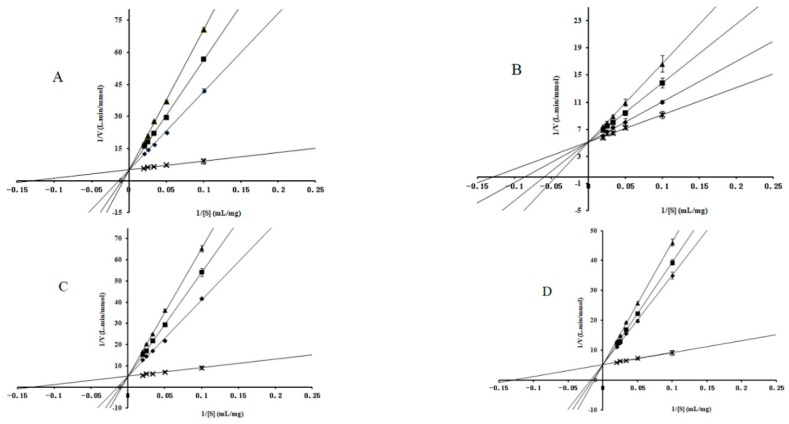
Figure 2.
Determination of the inhibition mode of molecules on maltase using Lineweaver–Burk reciprocal plots. (A) The concentrations of 1-DNJ were 0 (×), 12.5 (◆), 25.0 (■) and 50.0 (▲) × 10−6 mol/mL. (B) The concentrations of FA were 0 (×), 17.0 (◆), 34.0 (■) and 68.0 (▲) × 10−6 mol/mL. (C) The concentrations of DAB were 0 (×), 27.3 (◆), 54.5 (■) and 109.0 (▲) × 10−6 mol/mL. (D) The concentrations of acarbose were 0 (×), 6.3 (◆), 12.5 (■) and 25.0 (▲) × 10−6 mol/mL. The concentrations of maltose were 0.028, 0.056, 0.083, 0.111, and 0.138 M. Data are presented as mean ± SD.

