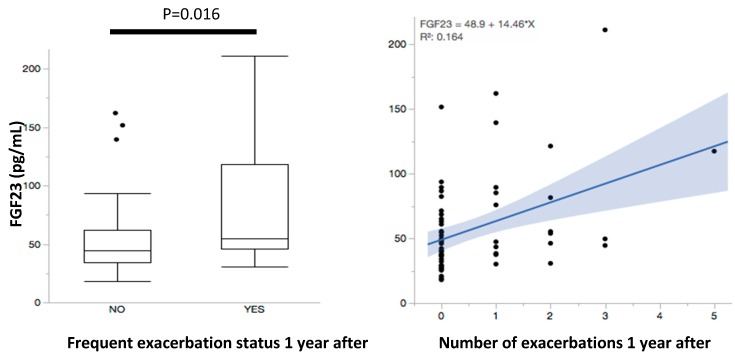
Figure 2.
FGF23 levels and correlation with number of exacerbations 12 months after FGF23 sampling. The left panel shows a whisker plot for FGF23 plasma levels in individuals without and with frequent exacerbations that occurred 12 months after sampling for FGF23 measurements. The right panel illustrates the correlation (shaded band representing the 95% confidence interval of the fitted values) between FGF23 plasma levels and number of exacerbations for this time frame.

