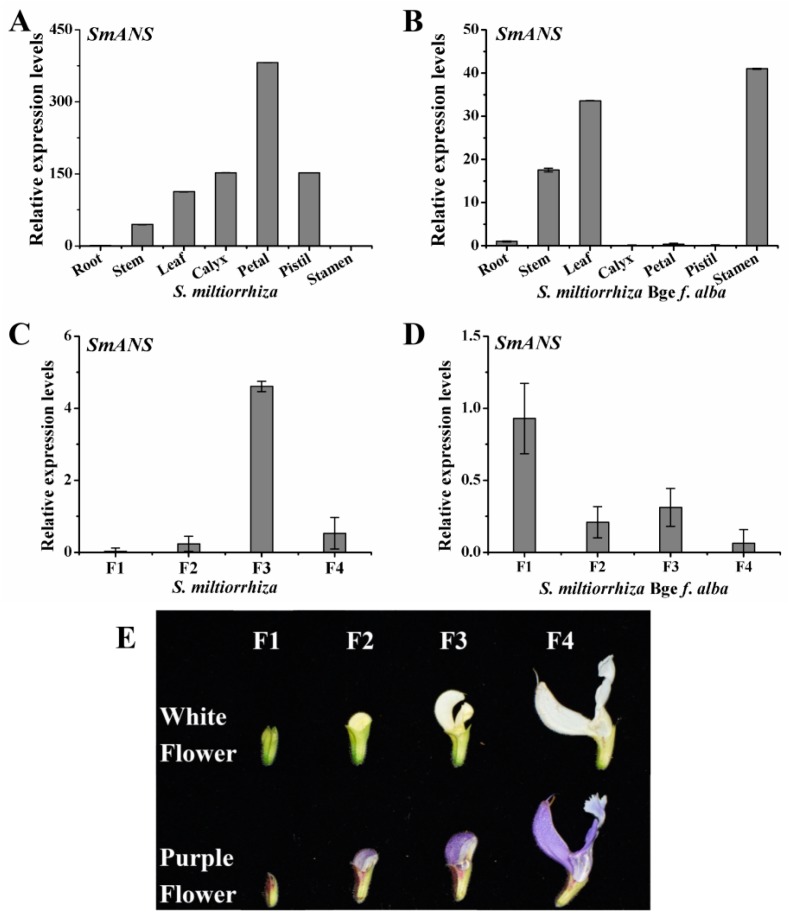
Figure 2.
Spatial-temporal expression of SmANS in Salvia miltiorrhiza and S. miltiorrhiza Bge f. alba. (A) Relative expression levels of SmANS in various organs of S. miltiorrhiza; (B) Relative expression levels of SmANS in various organs of S. miltiorrhiza Bge f. alba; (C,D) Relative expression levels of SmANS in flowers of four flowering stages from S. miltiorrhiza and S. miltiorrhiza Bge f. alba, respectively; (E) The purple flowers S. miltiorrhiza and white flowers S. miltiorrhiza Bge f. alba of four flowering stages. F1, young-bud; F2, medium-bud; F3, pre-bloom petal; and F4, full-bloom petal. The vertical bars show the SD values from three independent biological replicates.

