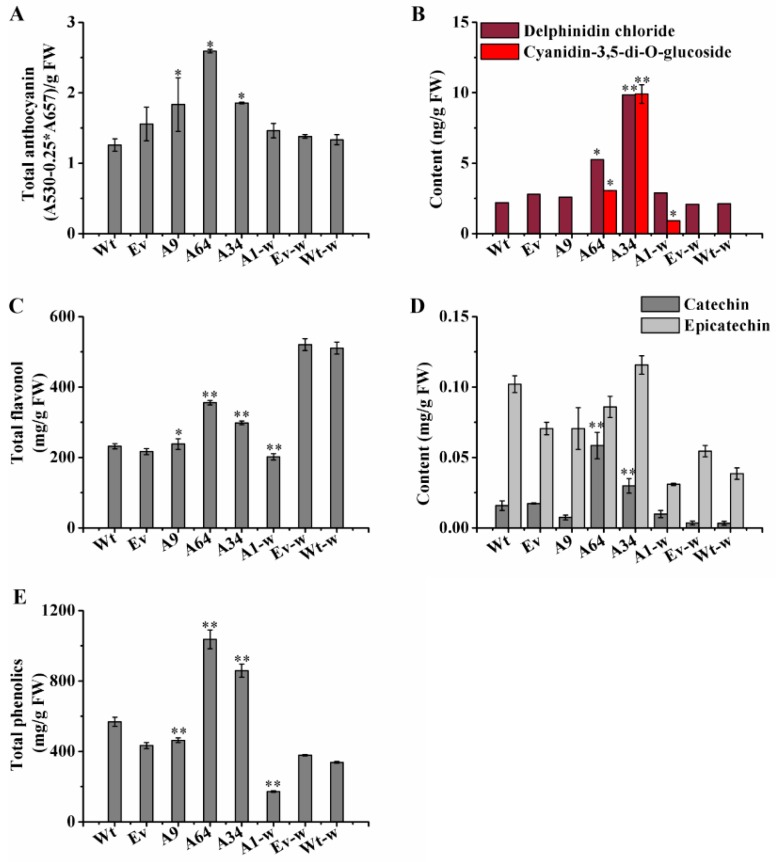
Figure 5.
Analysis of flavonoids and total phenolics in transgenic lines. (A) The content of total anthocyanin in controls and transgenic lines; (B) The contents of delphinidin and cyaniding 3,5-di-O-glucoside in controls and transgenic lines; (C) The content of total flavonoid from controls and transgenic lines; (D) The contents of catechin and epicatechin analyzed by HPLC; (E) Total phenolics content from controls and transgenic lines. Wt, the controls that were untransformed wild S. miltiorrhiza plants. Ev, the controls that only transformed the empty vector in S. miltiorrhiza. A9, A64, and A34, three transgenic lines of SmANS -overexpressed in S. miltiorrhiza. A1-w, transgenic line of SmANS-overexpressing in S. miltiorrhiza Bge f. alba. Ev-w, the controls that only transformed the empty vector in S. miltiorrhiza Bge f. alba. Wt-w, the controls that were untransformed wild S. miltiorrhiza Bge f. alba plants. FW, fresh weight. The vertical bars show the SD values from three independent biological replicates. (*) indicated a significant difference (0.01 < p < 0.05). (**) indicated a very significant difference (p < 0.01).

