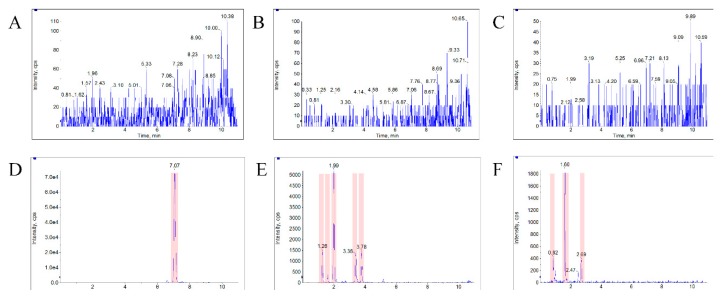
Figure 4.
The typical MRM chromatograms of metabolites. (A), (B), and (C) represent the metabolites’ m/z 387.4–369.6, 403.25–349.22, and 419.24–365.21 in blank plasma, respectively. (D), (E), and (F) represent the three metabolites in a plasma sample from a rat with a single dose of 10 mg/kg bufalin.

