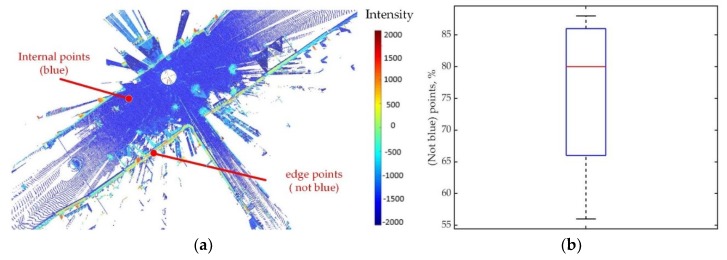
Figure 2.
(a) Depending on the distribution of intensity value in point cloud, it can be found that the high-intensity points (not blue) are usually on the edge of point cloud with low-intensity points (blue) inside. Therefore, the point cloud composed of high intensity points can represent the shape of the point cloud. (b) Based on 100 times experiments to intensity point selection, it can be seen that most of points (not blue) can be extracted for filtered point cloud by Equations (8) and (9).

