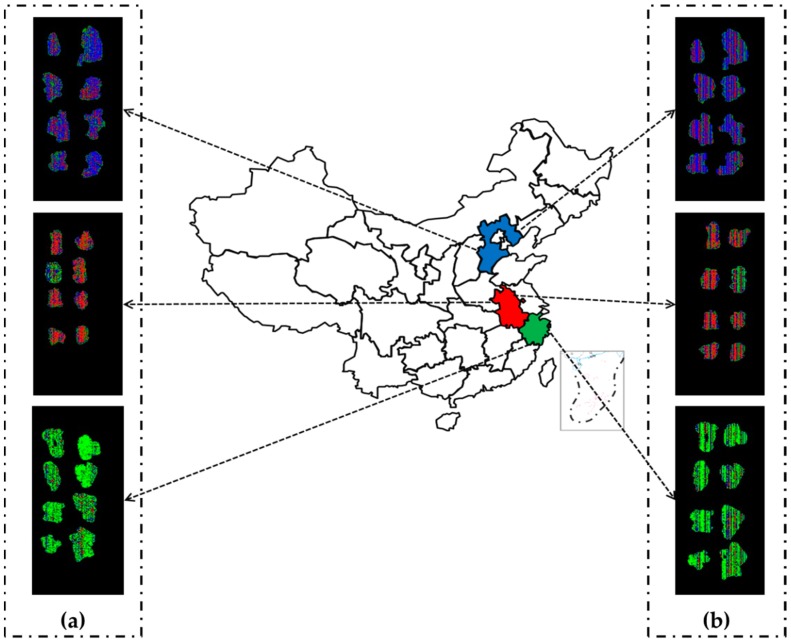
Figure 8.
Classification maps by PLS-DA models in the VNIR range (435–898 nm) (a) and the SWIR range (900–1601 nm) (b) based on the prediction set. The red, green and blue represent Anhui, Zhejiang, and Hebei, respectively. The non-uniform distribution resulted from the categories of pixels not being completely consistent.

