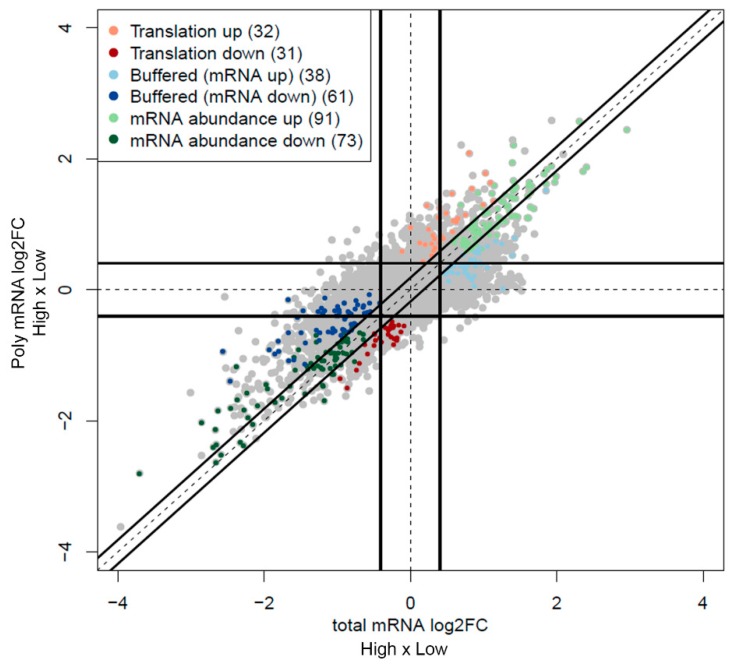
Figure 4.
Representation of the differentially transcribed and translated genes. Microarray expression data from total and poly mRNA was analyzed by anota2seq in the comparison of high- and low-grade fragments. Gene expression values in total and poly mRNA are plotted and the regulation modes are indicated by different colors (translation—orange and red, buffering—light and dark blue, abundance— light and dark green).

