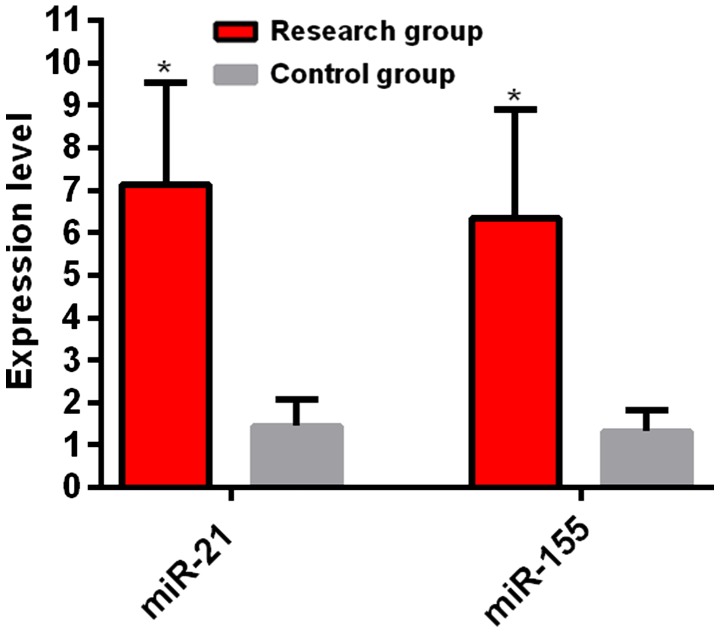
Figure 1.
Comparison of serum miR-155 and miR-21 expression levels between the research group and the control group. RT-qPCR results showed that the expression levels of miR-21 and miR-155 in the research group were higher than those in the control group. *P<0.05, the difference was statistically significant compared with the control group.

