Figure 3.
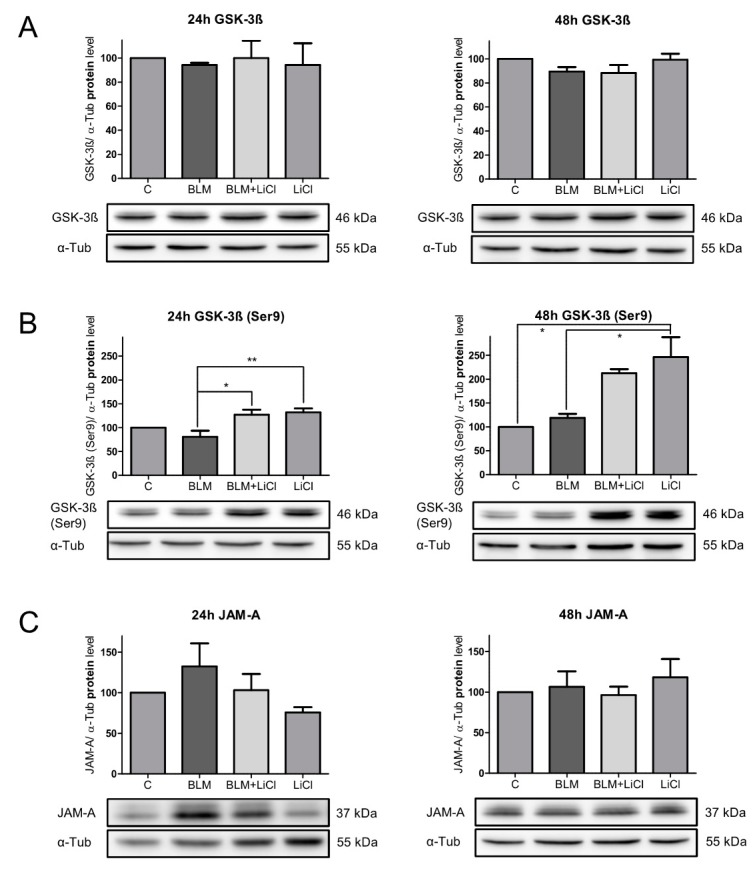
Expression of total GSK-3β (A), GSK-3β(Ser9) (B), and JAM-A (C) were analyzed by Western blot after 24 h and 48 h treatment with 100 mU/mL BLM, 100 mU/mL BLM, and 10 mM LiCl or 10 mM LiCl alone. Equal protein amounts of cell lysates were used in SDS-PAGE and analyzed by Western blot. α-Tub served as the loading control. Untreated cells were used as the control and normalized to 100%. Representative blots from three independent experiments are shown. Charts presented as mean ± SEM (n = 3) of GSK-3β /α-Tub, GSK-3β(Ser9)/α-Tub, and JAM-A/α-Tub. P-values: 24 h GSK-3β 0.9447; 48 h GSK-3β 0.0625; 24 h GSK-3β(Ser9) 0.0046; 48 h GSK-3β(Ser9) 0.0066; 24 h JAM-A 0.186; and 48 h JAM-A 0.6123. * p < 0.05, ** p < 0.01.

