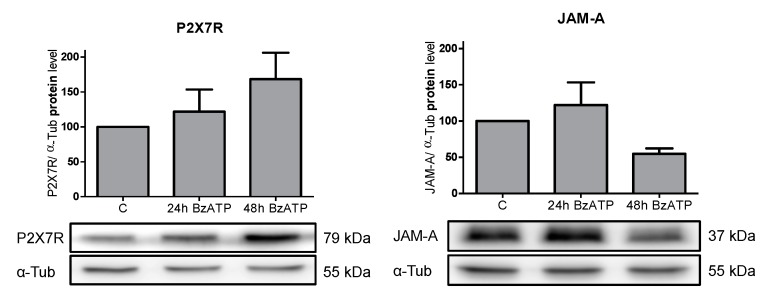
Figure 5.
Analysis of protein levels in alveolar epithelial cell line E10 after treatment with 150 µM BzATP. Cells were treated with BzATP for 24 h and 48 h. For SDS-PAGE, equal protein amounts of cell lysates were used and analyzed by Western blot with antibodies against P2X7R, JAM-A, and α-Tub. Untreated cells were used as the control and normalized to 100%. Protein levels were normalized to α-Tub and are shown as the mean ± SEM (n = 3) in relation to the control. One representative blot is pictured. P-values: P2X7R 0.1667 and JAM-A 0.1048.

