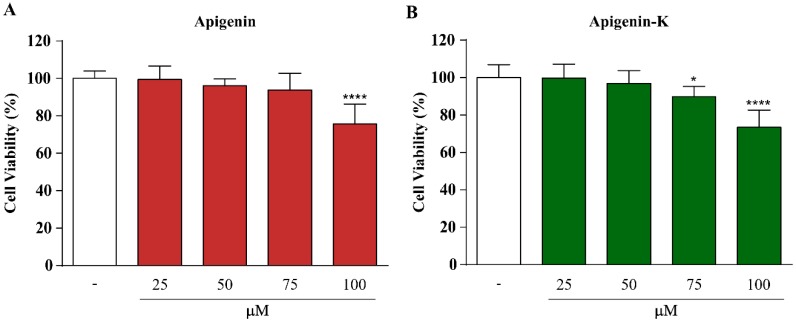
Figure 2.
Cytotoxic effects of apigenin (A) and apigenin-K (B) treatment (25, 50, 75 or 100 µM) for 2 h in Caco-2 cells determined using the MTT assay. The data are expressed as the means of 6 replicates ± SDs. * p < 0.05 and **** p < 0.0001 indicate statistically significant differences compared with nontreated cells.

