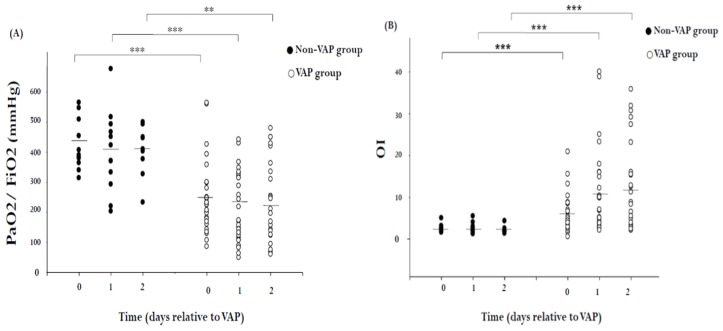
Figure 1.
Scatter plots of respiratory data in 30 patients with VAP and 12 non-VAP subjects. (A) Hypoxemia score (the ratio of arterial oxygen partial pressure to fractional inspired oxygen; PaO2/FiO2) and (B) oxygenation index (OI = FiO2 × mean airway pressure/PaO2) in VAP patients and non-VAP patients (circle). Each dot represents a single patient. The solid lines mark the mean values. ** p < 0.01, *** p < 0.001 by Mann–Whitney U test.

