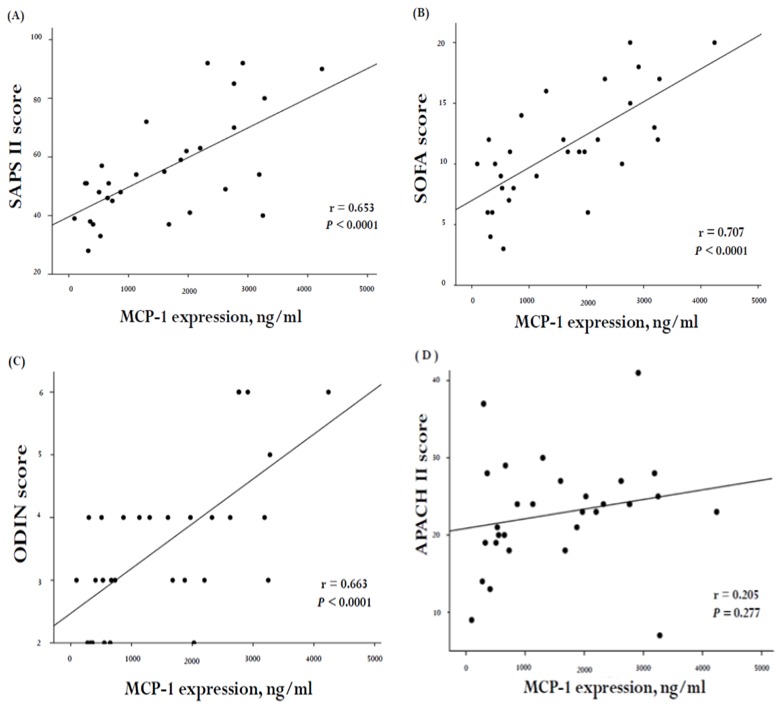
Figure 5.
Correlation of plasma MCP-1 with severity of organ failure score (non-specifically for VAP) in 30 VAP subjects. There was a positive correlation between MCP-1 levels and (A) SAPSII (general linear model, r = 0.653, p < 0.0001, n = 30), (B) SOFA (general linear model, r = 0.707, p < 0.0001, n = 30), (C) ODIN (general linear model, r = 0.663, p < 0.0001, n = 30) and (D) APACH II (general linear model, r = 0.205, p = 0.277, n = 30)

