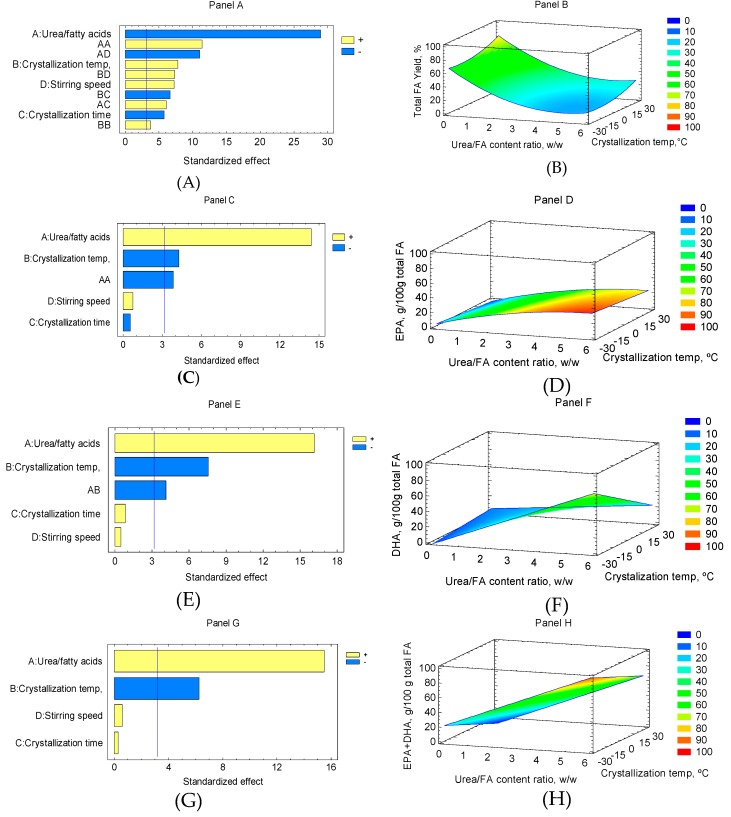
Figure 1.
Pareto charts and response surfaces for the effects of different process variables: Panels in total FA yield (%, panels A,B), EPA content (g/100 g total FA, panels C,D), DHA content (g/100 g total FA, panels E,F), EPA+DHA content (g/100 g total FA, panels G,H). A: urea/FA contents ratio, w/w; B: crystallization temperature, °C; C: crystallization time, h; and D: stirring speed, rpm).

