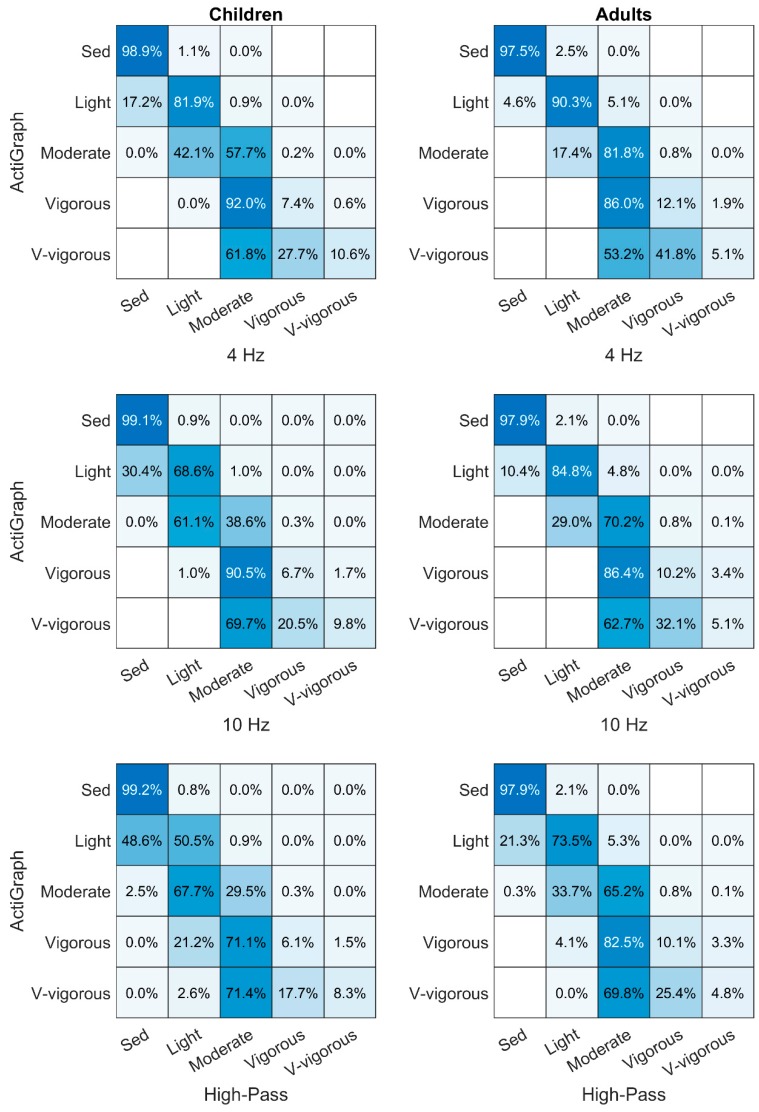
Figure 4.
Row-normalized confusion charts comparing ActiGraph-filtered output with output from the modified filters epoch by epoch. Numbers on the diagonal from the upper left to lower right corner with 100% would indicate a perfect agreement between the filters whereas numbers in the lower or upper triangles from the diagonal indicate that the modified filters classify the activity intensity as lower or higher, respectively.

