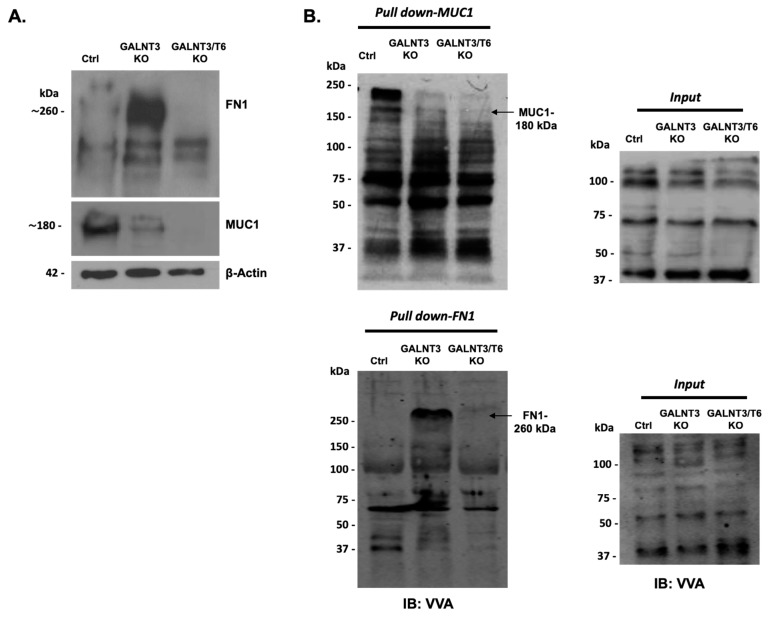
Figure 2.
Glycoprotein analysis in GALNT3 KO and GALNT3/T6 KO clones. (A) Western blot analysis of FN1 and MUC1 expression in the GALNT3 KO and GALNT3/T6 KO clones compared with Ctrls in the A2780s cell line. β-actin was used as the loading control. (B) VVA-lectin-mediated immunoblot analysis of GalNAc-conjugated proteins in protein lysates of the Ctrl, GALNT3 KO, and GALNT3/T6 KO A2780s clones following VVA lectin pull-down assay (pull-down). Upper panel: pull-down MUC1; lower panel: pull-down FN1. Analyses of the crude protein extracts (input) demonstrate comparable total proteins expression levels in the different samples. Arrows indicate the glycosylated protein band.

