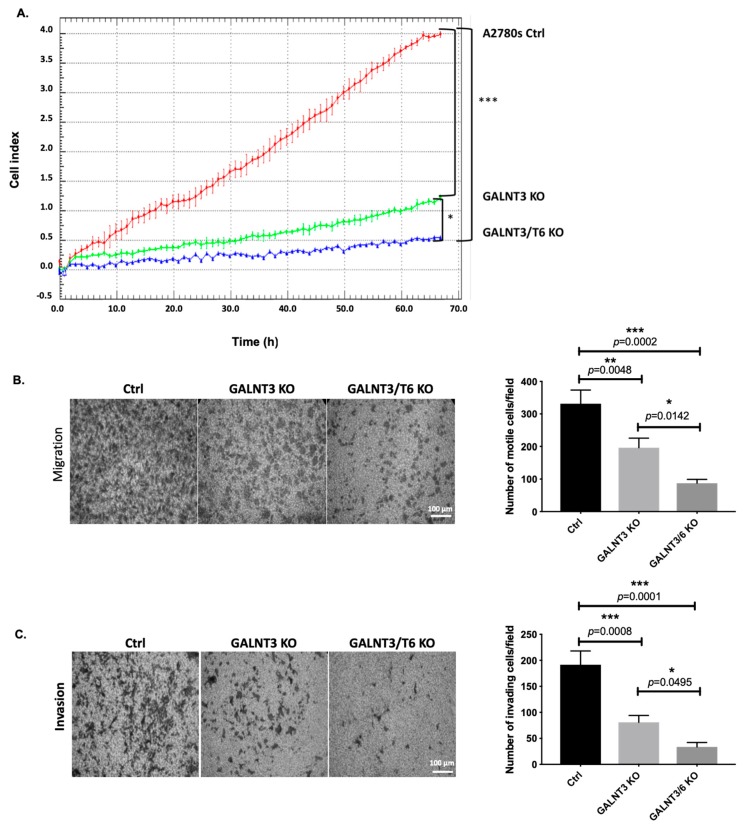
Figure 3.
Effect of the GALNT3 KO and the double GALNT3/T6 KO on A2780s cell proliferation, migration and invasion. (A) Cell proliferation of GALNT3 KO and GALNT3/T6 KO clones compared with the control clone (Ctrl). Cell index refers to a relative change in electrical impedance representing the number of cells detected on the microelectrodes on the bottom of the xCELLigence wells. (B) Cell migration of GALNT3 KO and GALNT3/T6 KO clones compared with the control clone (Ctrl) (scale bar 100 μm). (C) Cell invasion of GALNT3 KO and GALNT3/T6 KO clones, as compared with the control clone (Ctrl) (scale bar 100 μm). The corresponding histograms represent quantitative determinations of migration and invasion data obtained by selecting 10 random fields per filter under phase contrast microscopy; results are expressed as number of cell changes (migration and invasion) of GALNT3 KO and GALNT3/T6 KO clones compared with the control clone (Ctrl) (n = 3). Data are presented as mean ± SEM and were analyzed by one-way ANOVA followed by a Dunnett’s test for multiple comparisons. A significant association was considered when p-values were <0.05. GraphPad style was used for p-value presentation; p-value symbols refer as follows: ns p > 0.05, * p ≤ 0.05, ** p ≤ 0.01, *** p ≤ 0.001, **** p ≤ 0.0001.

