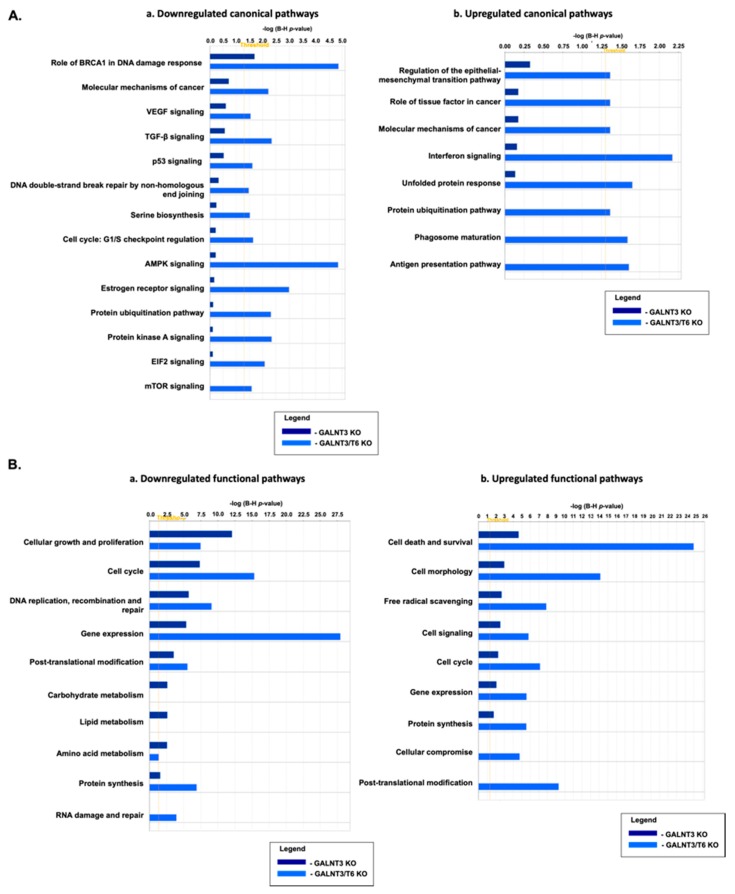
Figure 4.
Comparative canonical and functional pathway analysis for a dataset of differentially expressed genes (≥1.5-fold; p < 0.05) following GALNT3 KO and GALNT3/T6 KO in A2780s cells. (A) (a) Comparison analysis of downregulated canonical pathways; (b) comparison analysis of upregulated canonical pathways. Top functions that meet a Holm–Bonferroni multiple testing correction p-value of 0.05 are displayed. (B) (a) Comparison analysis of downregulated functional pathways; (b) comparison analysis of upregulated functional pathways. Top functions that meet a Holm–Bonferroni multiple testing correction p-value of 0.05 are displayed. The bar-charts represent significance of gene enrichment for any given pathway with scores of 2 < z-score < −2.

