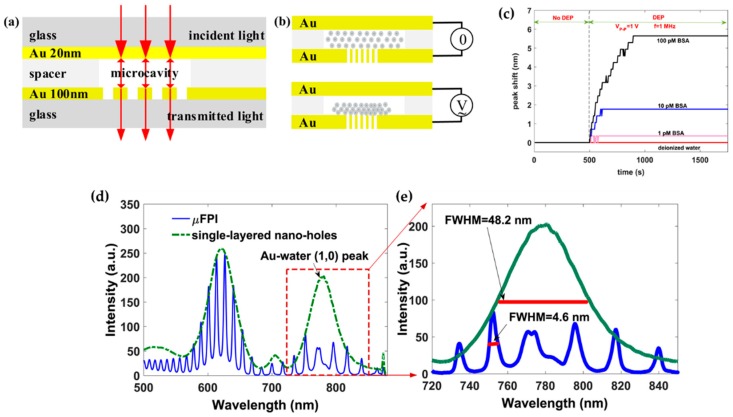
Figure 11.
(a) Schematic representation of the plasmonic sensing device. (b) Conceptual representation of DEP on particle transportation. (c) DEP effect on transporting BSA proteins in different concentration solutions. (d) Transmission spectrum for the nanohole array with two peaks from the EOT effect (green dash-dot curve) and FP resonances within the transmission profile (blue solid curve). (e) Zoomed in curve for the transmission peak in the long wavelength range. Adapted from [143], with permission © 2018 Elsevier B.V.

