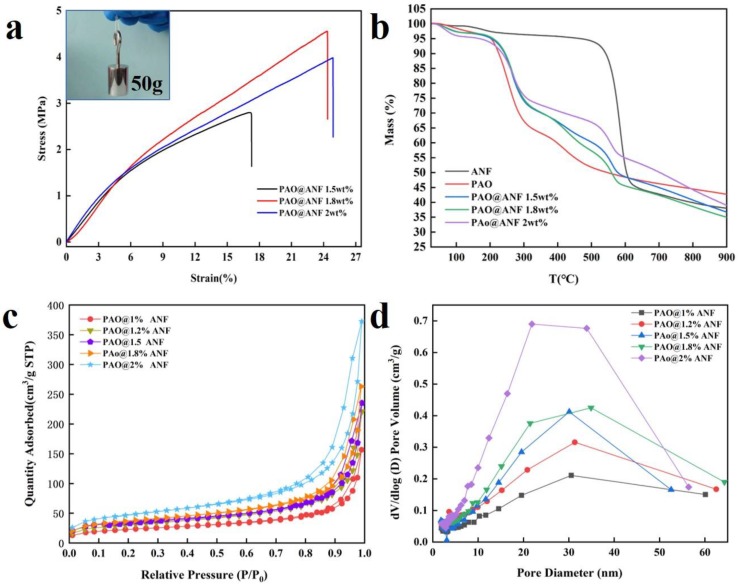
Figure 3.
(a) The stress–strain curves of the PAO@ANF aerogel fibers formed in ANF solution with concentration from 1.5–2.0 wt.%, inset in e is the photo image of the PAO@ANF aerogel fiber bearing a 50 g weight. (b) TGA curves of ANF, PAO, and PAO@ANF aerogel fibers. (c) N2 adsorption–desorption isotherms and (d) pore size distribution curves of the PAO@ANF aerogel fibers.

