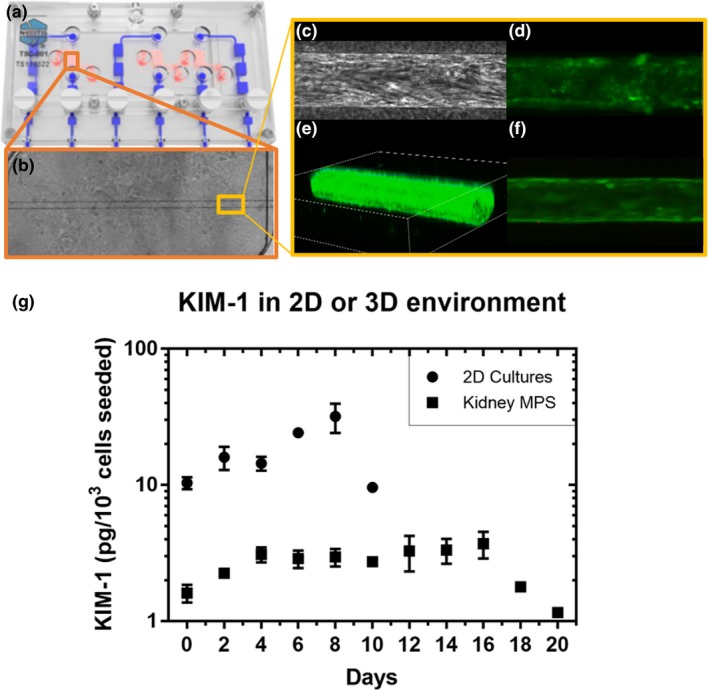
Figure 2.

Overview of the kidney microphysiological system (MPS) hardware and biology. (a) The Nortis (Seattle, WA) HARV‐1 triple single channel. In red is the chamber for cell culture and in blue is the perfusion pathway for media. (b) A phase contrast image of a fully confluent proximal tubule in the collagen I chamber of the HARV‐1. (c) A phase contrast image of a segment of the proximal tubule showing human renal proximal tubule cells organized in the direction of flow. (d) Staining using fluorescein‐conjugated lotus lectin to mark the brush border of the human renal proximal tubule cells. (e) A three‐dimensional projection of the confluent proximal tubule in the kidney MPS. (f) A live/dead stain showing a healthy proximal tubule segment. (g) The difference in kidney‐injury molecule 1 (KIM‐1) secretion between cells in the two‐dimensional system and kidney MPS, representing two‐dimensional and three‐dimensional microenvironments, respectively, measured during a 2‐day interval. Data were corrected for sample volume and cell number differences.
