
Figure 6.
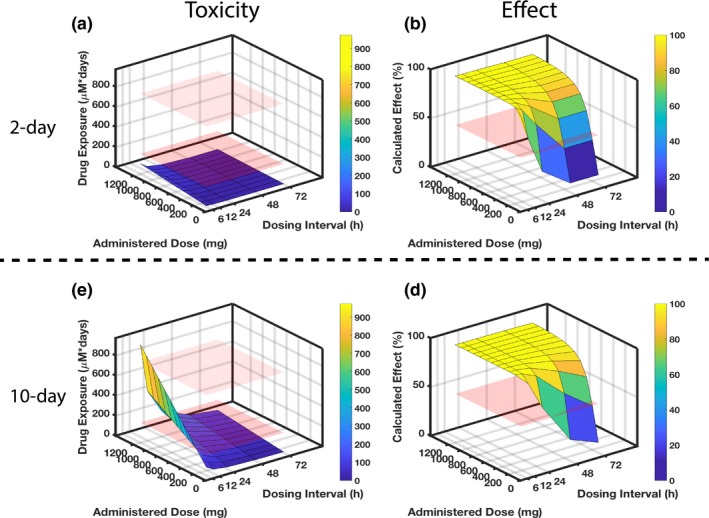
Identifying optimal rifampicin clinical dosing regimen. Combining experimental and computational efforts allows identification of optimal dosing regimens with respect to organ‐specific toxicity and drug effect after 2‐day (top) and 10‐day (bottom) drug exposure. Regarding the toxicity in parts (a) and (c), the red planes indicate rifampicin exposure levels that correspond to known experimental toxicity outcomes: the lower plane indicates no adverse effect observed in either kidney‐injury molecule 1 or viability (measured by metabolic activity with PrestoBlue (Invitrogen, Carlsbad, CA)) after 2‐day exposure to the 100 μM drug; the upper plane indicates the exposure at which adverse effects become apparent, with both kidney‐injury molecule 1 and viability declines for the 10‐day exposure to the 100 μM drug. Regarding the efficacy in parts (b) and (d), the red plane sits at 50% calculated effect as a comparison to the dose‐dependent and dose interval–dependent surfaces that are simulated for results. (a) The 2‐day rifampicin exposure for a range of drug doses and dosing intervals reveals no dosing regimen that would lead to kidney toxicity in a clinical setting as all exposures are below the “no adverse effect” lower plane. To be effective at killing bacteria within 2 days, however, requires frequent dosing, e.g., every 12 hours at 600 mg. (c) When extending the drug exposure to 10 days (lower panel), less frequent and lower dosing is needed to minimize toxicity. (d) Concomitantly, the longer dosing intervals and reduced doses will negatively impact effectiveness.