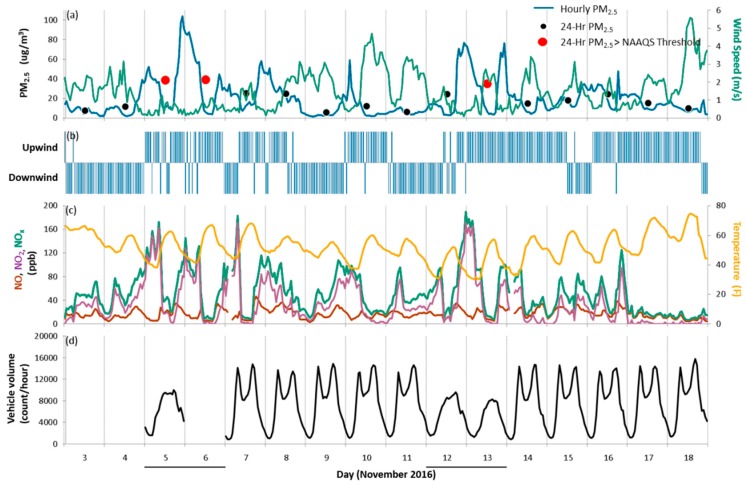
Figure 7.
Indianapolis case characterization. Time series of meteorological, air quality, and traffic-related data from 3–18 November 2016, at the Indianapolis-0087 near-road monitoring site: (a) 1-h PM2.5 concentrations (blue line), 24-hr PM2.5 concentrations (black and red dots, where red dots highlight 24-h PM2.5 concentrations that exceeded the 35 μg/m3 NAAQS threshold), and wind speed (green line); (b) wind component (downwind means the near-road monitor was downwind of I-70, with winds originating from 240 to 60°); (c) NO (red line), NO2 (purple line), and NOx (green line) concentrations, and temperature (orange line); and (d) traffic volume (vehicle count per hour). Weekend days are underlined along the x-axis.

