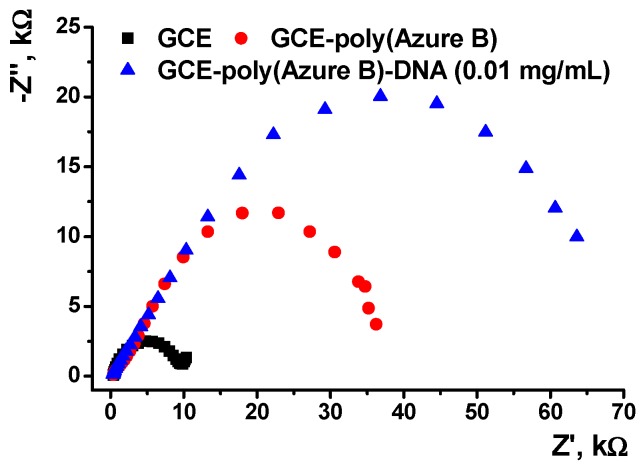
Figure 4.
The electrochemical impedance spectroscopy (EIS) characterization of the surface layer assembling. The Nyquist diagram of impedance spectra recorded on GCE covered with poly(Azure B) (40 cycles) and incubated in 0.01 mg/mL DNA solution. Measurements in the presence of 0.01 M K3[Fe(CN)6] and 0.01 M K4[Fe(CN)6] at 0.27V. Frequency range 0.04 Hz–100 kHz, amplitude 5 mV.

