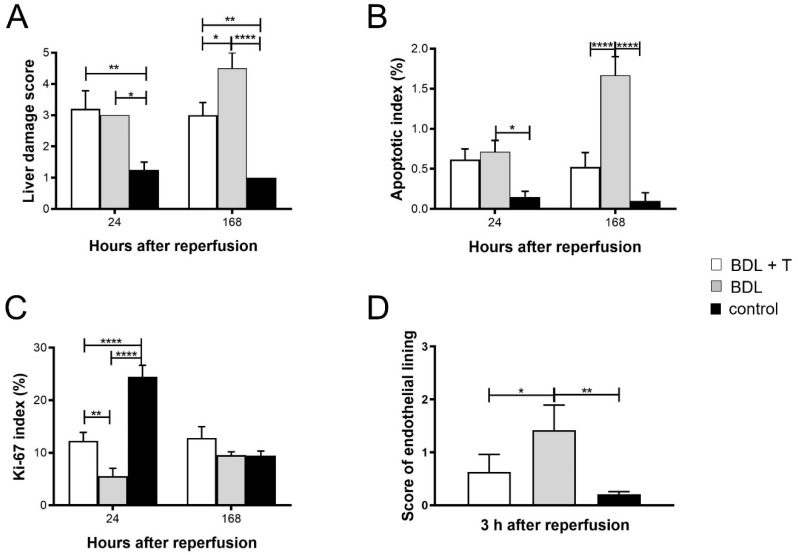
Figure 7.
Histopathological changes in livers in the different treatment groups were analyzed in (A) Hematoxylin and eosin (HE) staining applying a semi-quantitative score, in (B) transferase-mediated d-UTP nick-end labeling (TUNEL) staining shown as apoptotic index (in %), in (C) Ki-67 staining measuring proliferation (in %) of Kupffer cells and sinusoidal endothelial cells and infiltration of inflammatory cells and in (D) RECA-1 staining in order to score the endothelial lining. Mean and standard deviation are shown in each group with significance levels of * p < 0.05, ** p < 0.01, **** p < 0.0001.

