Figure 1.
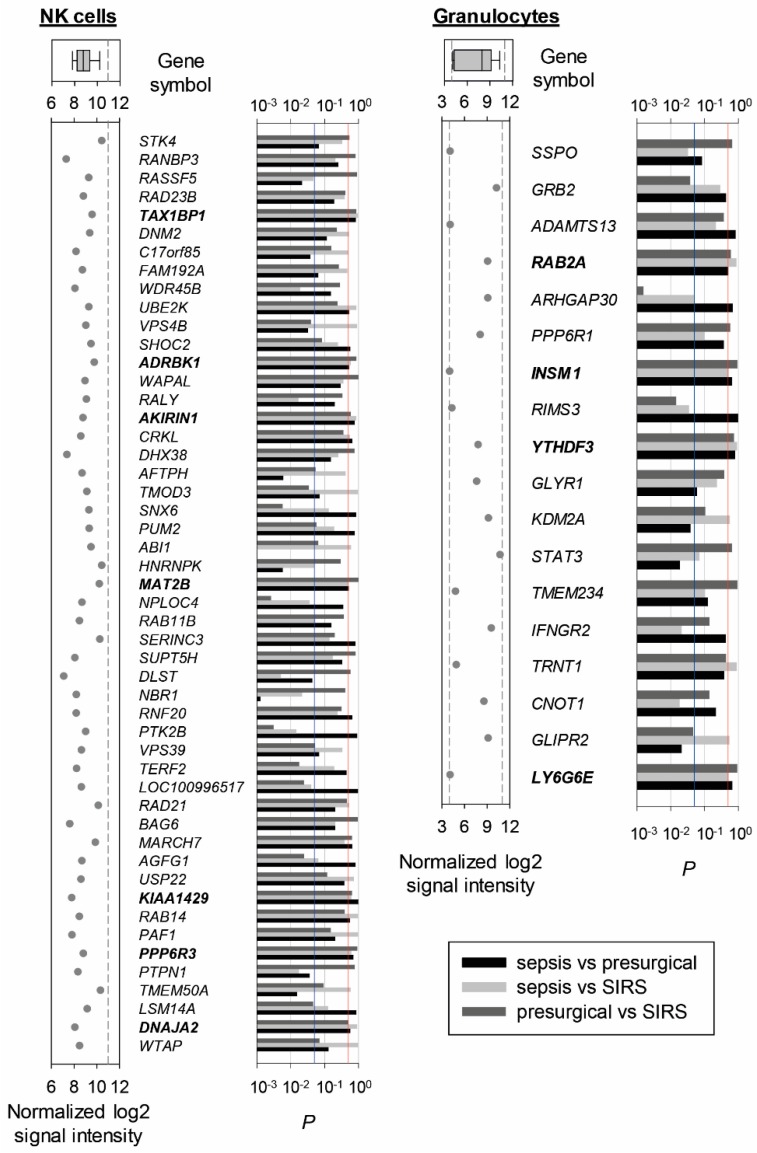
Discovery of candidate reference genes from microarray data of NK cells and granulocytes from presurgical, SIRS, and sepsis patients (discovery set). Genes without significant difference in abundance from one-way analysis of variance with false discovery rate correction (α > 0.05) and with intermediate normalized log2 signal intensity values were selected. They were ordered from top to bottom by decreasing variability across all 45 NK cell samples (19 presurgical, 16 SIRS, and 10 sepsis), of which the top 50 are shown on the left, and all 42 granulocyte samples (11 presurgical, 16 SIRS, and 15 sepsis) for which only the 18 genes shown on the right met the selection criteria. To the left of the gene symbols, normalized log2 signal intensities from the microarrays are given with dashed lines indicating the cutoff intensities from our selection criteria. On top, corresponding box plots with whiskers from 5th to 95th percentile and median are plotted. The bars to the right represent p-values from unadjusted t-tests for the corresponding three pairwise patient group comparisons. The blue line marks the significance threshold of p = 0.05, and the red line marks the threshold of p = 0.5 for selecting genes with putatively highly similar abundance among the three groups. Genes with above- or borderline-threshold p-values for all three comparisons are printed in bold.

