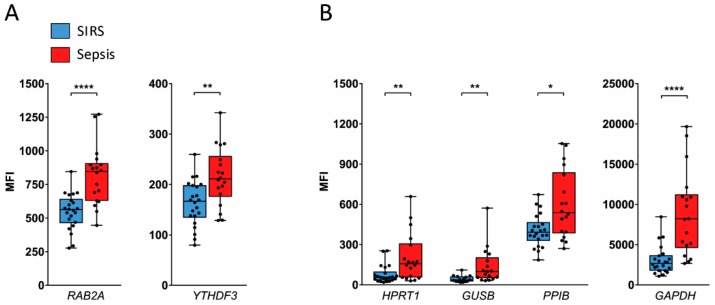
Figure 5.
Comparison of candidate reference gene expression in granulocytes from the validation set by QGP. Results for two detectable candidate reference genes identified from microarray (A) and four additional known reference genes (B) are grouped by similar signal intensity (MFI) ranges. Data are represented as blue (SIRS, n = 22) and red (sepsis, n = 18) box plots with whiskers from minimum to maximum, median, and dispersion plots. As an exception, only 15 samples from patients with SIRS and 17 with sepsis were available for GUSB. * p < 0.05, ** p < 0.01, **** p < 0.0001 from the Wilcoxon rank-sum test.

