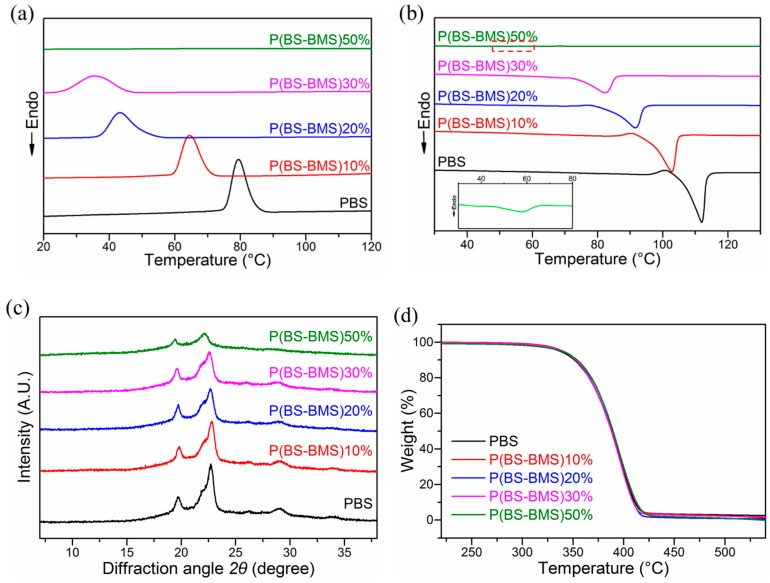
Figure 4.
DSC curves of pure PBS and P(BS-BMS) copolymers during (a) first cooling from melt at a cooling rate of 10 °C/min and (b) second heating process at a heating rate of 10 °C/min (inner figure is magnified second heating curve of P(BS-BMS)50%); (c) WAXD patterns of pure PBS and P(BS-BMS) copolymers; (d) TGA curves of pure PBS and P(BS-BMS) copolymers at a heating rate of 10 °C/min under N2.

