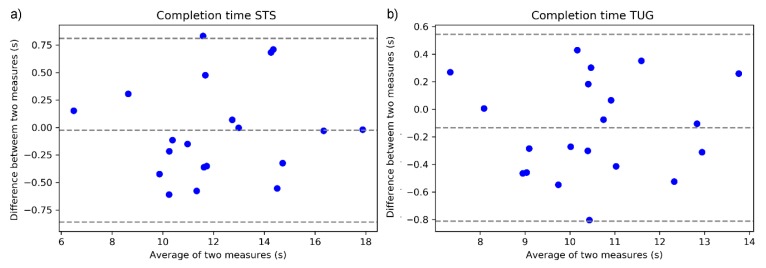
Figure 3.
Bland-Altman plot of the sensor-derived and stopwatch timed task completion time. (a) STS completion time; and (b) TUG completion time. The Y-axis indicates the difference between the measures (a positive value indicates that the stopwatch measure is larger than the sensor-derived measure).

