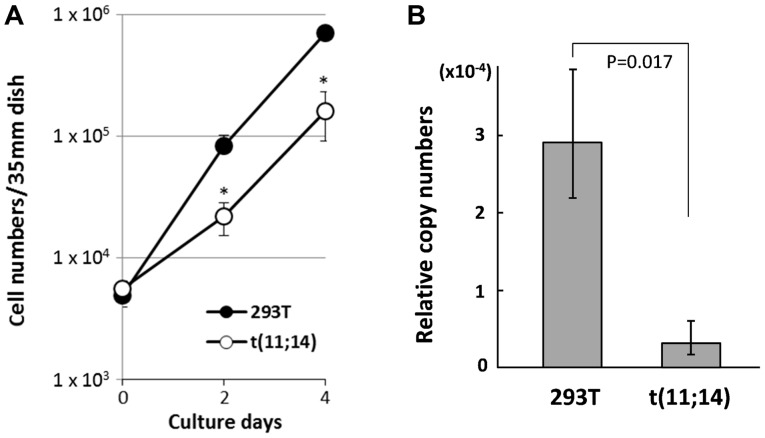
Figure 5.
Characteristics of 293T cells harboring t(11;14). (A) Growth curves of t(11;14) 293T cells and parental cells. Viable cell numbers are indicated on days 0, 2, and 4 (n=3). Error bars indicate the standard deviation. *P<0.05 vs. 293T. (B) Reverse transcription-quantitative PCR analysis of CCND1. Relative copy numbers were calculated using GAPDH as a reference (n=3). CCND1, cyclin D1.

