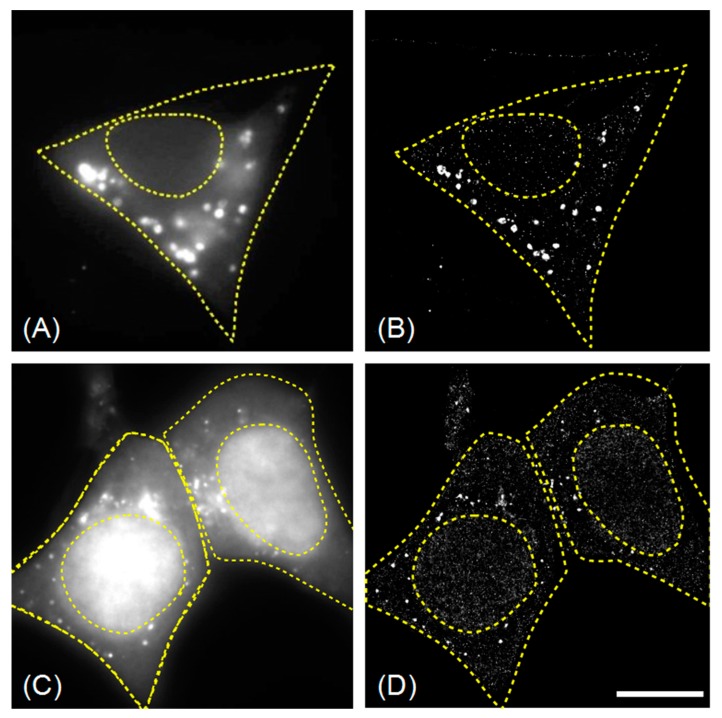
Figure 1.
Wide-field (A,C) and SMLM (B,D) images of fixed HEK293 cells (starved and bafilomycin A1-treated) expressing EYFP-GABARAP (A,B), and EYFP-LC3B (C,D). In the wide-field fluorescence images only a few labelled structures are found (A: 22; C: 35 and 20 in the left and right cell, respectively), while in the corresponding super-resolution images (B,D) the numbers of EYFP-GABARAP containing structures (1640) and EYFP-LC3B containing structures (3100 and 1564) are almost two orders of magnitude larger. Scale bar (valid for A–D): 10 µm.

