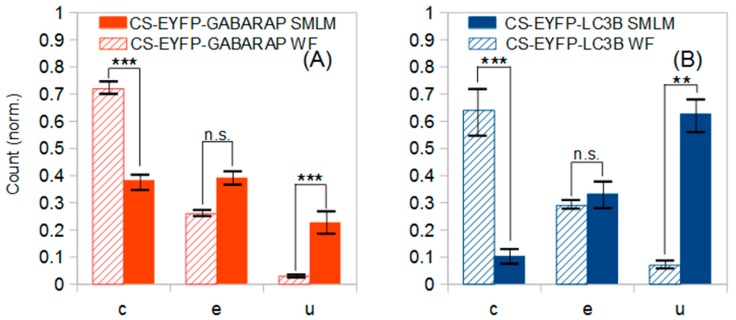
Figure 7.
Shape distributions of fluorescently labelled cytoplasmic structures identified in the wide-field images of ten EYFP-GABARAP expressing and ten EYFP-LC3B expressing HEK293 cells, respectively, under starvation and bafilomycin A1 treatment. (A) Conventionally selected CS-EYFP-GABARAP (348) classified in wide-field fluorescence (hatched bars) and the same structures classified in the respective SMLM (full bars) images; (B) Conventionally selected CS-EYFP-LC3B (486) classified in wide-field fluorescence (hatched bars) and the same structures classified in the respective SMLM (full bars) images. Error bars represent standard error of the mean. Statistical significance is represented as P ≤ 0.01 (∗∗∗); P ≤ 0.05 (∗∗), and P ≤ 0.1 (∗) from two-tailed t-tests (n.s., not significant). c, e and u stands for circles, ellipses and U-shapes.

