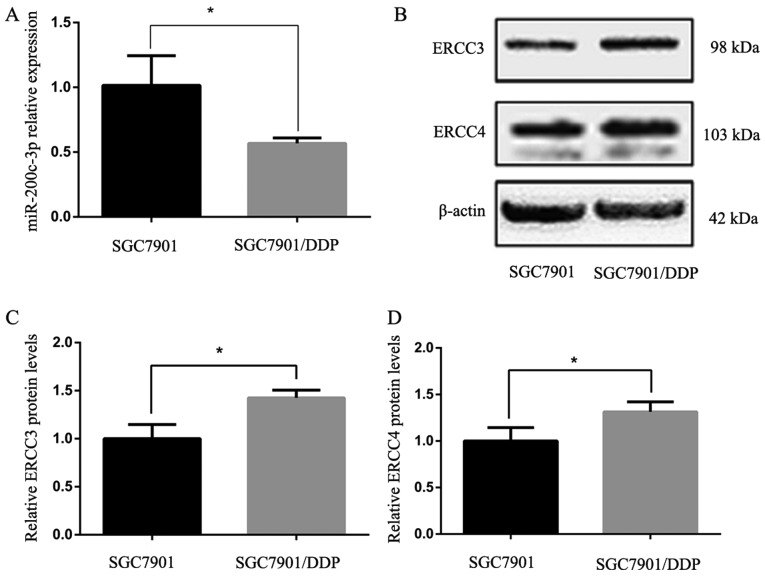
Figure 1.
Expression levels of miR-200c-3p, ERCC3 and ERCC4 in gastric cancer cell lines following lentiviral transduction. (A) Relative miR-200c-3p expression levels in SGC7901 cells and SGC7901/DDP cells, as measured by reverse transcription-quantitative polymerase chain reaction. The fold-change between SGC7901 cells and SGC7901/DDP cells was 1.788. (B) Western blot analysis detected higher ERCC3 and ERCC4 expression in SGC7901/DDP cells than in SGC7901 cells. (C and D) Semi-quantification of western blotting results shown in (B) via densitometry. *P<0.05. ERCC3, ERCC excision repair 3, TFIIH core complex helicase subunit; ERCC4, ERCC excision repair 4, endonuclease catalytic subunit; miR-200c-3p, microRNA-200c-3p.

