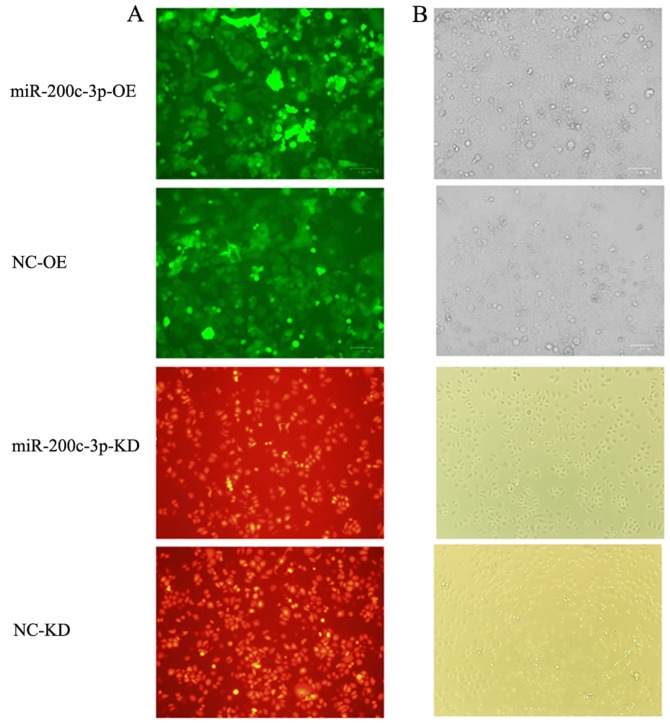
Figure 2.
Transduction efficiency observed under a fluorescence microscope. Cells with miR-200c-3p OE and empty vector control cells fluoresced green. Cells with miR-200c-3p KD fluoresced red, indicating that vectors carrying the target gene were transfected into cells. (A) Fluorescence microscope images (magnification, ×100). (B) Optical microscope images (magnification, ×100). KD, knockdown; LV, lentivirus; miR-200c-3p, microRNA-200c-3p; NC, negative control; OE, overexpression.

