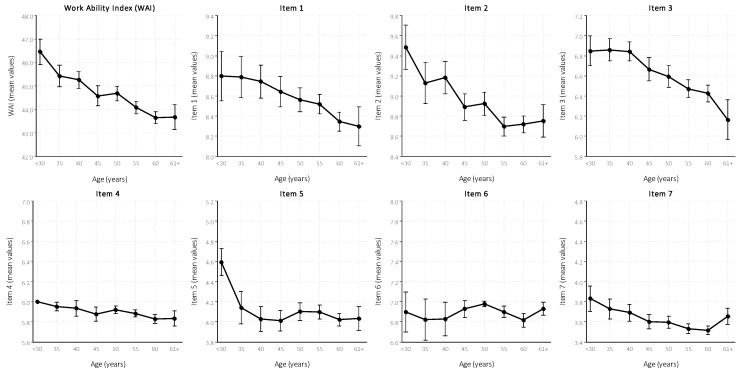
Figure 1.
Mean and standard deviation (sd) of the work ability index (WAI) and its component, according to age groups for 2077 visual display unit (VDU) operators. Italy, 2017.Item 1: current WA compared with lifetime best. Item 2: WA in relation to mental and physical demands of the job. Item 3: number of current diseases diagnosed by a physician. Item 4: estimated work impairment due to diseases. Item 5 sick leave during the past 12 months. Item 6: self-prognosis of WA for the next two years. Item 7: mental resources.

