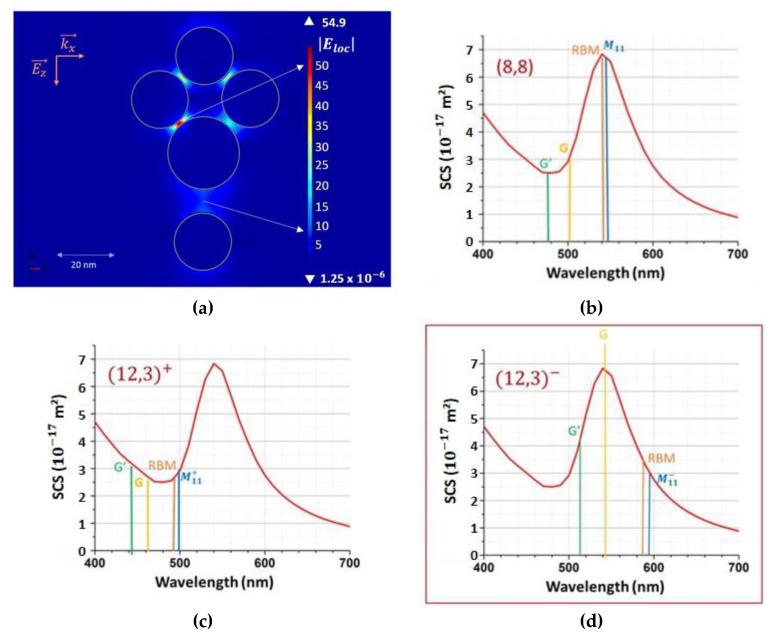
Figure 8.
FEM computations coupled with metallic CNT behaviors. (a) the FEM simulations of the electric field show (indicated with the white arrows) two strong enhanced field area. The CNT 1 is in the region where the field is enhanced by 10. The different possibilities to generate Raman resonance effects (at the excitation, transition M 11 in blue or at the scattered resonances for the three principal Raman CNT signals). (b) If CNT 1 was a (8,8) SWCNT the resonance at 561 nm would enhance the excitation Raman process, in this case, all the spectrum would be enhanced. (c) For the first electronic transition of a (12,3) SWCNT, neither the transition at the excitation and no inelastic scatterings could be enhanced by the resonance of the plasmonic molecule. (d) For the second transition of a (12,3) SWCNT, the Raman resonance at the excitation is weakly enhanced, while the Raman resonance at the scattering would favor the G-signal. This latter case allows interpreting the signals observed in Figure 5.

