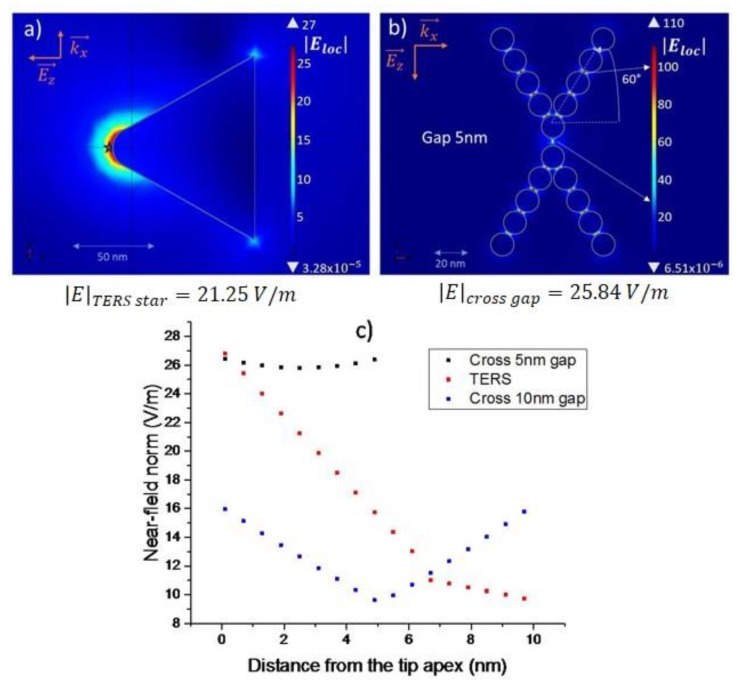
Figure 9.
Computed near-field mappings (a) of a TERS tip; (b) a tip consisting of 9 NPs of 20 nm in diameter. The angles with respect to the normal are identical for the two structures, i.e., 60°. The respective values of the near-field norm were taken at the star point for the TERS tip, and at the white mark for the gold cross gap. (c) Amplitudes of the local electric field vs either the distance at the apex of the tip (TERS in red points) or the positions in the gap when the gap is only 5 nm (black) or 10 nm (blue points).

