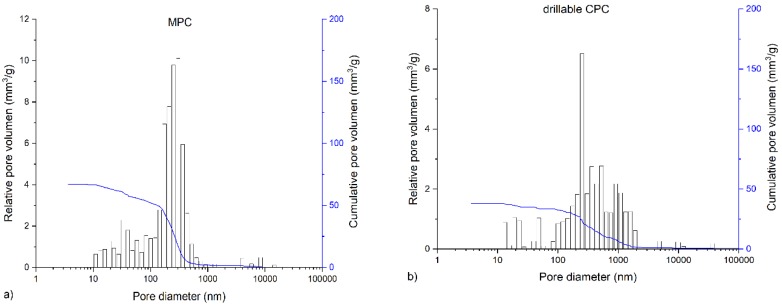
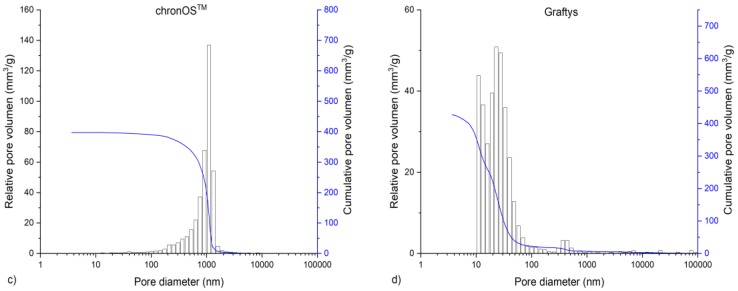
Figure 6.
Graphs of mercury porosity analysis. Displayed are the graphs of the mercury porosity analysis for each bone substitute used in the study, (a) Magnesium phosphate cement; (b) Dual setting α-TCP/HEMA cement; (c) ChronOSTM Inject; (d) Graftys® Quickset. Relative pore volume (mm3/g) as well as cumulative pore volume (mm3/g) as a function of pore diameter are shown. Lowest cumulative porosity for in-house formulations and largest pores in ChronOSTM were determined: An equivalent low cumulative pore volume was found for the drillable CPC and MPC, whereas the commercial formulations showed distinctly higher cumulative pore volumes. The highest average pore volume and median pore volume were determined for ChronOSTM Inject.


