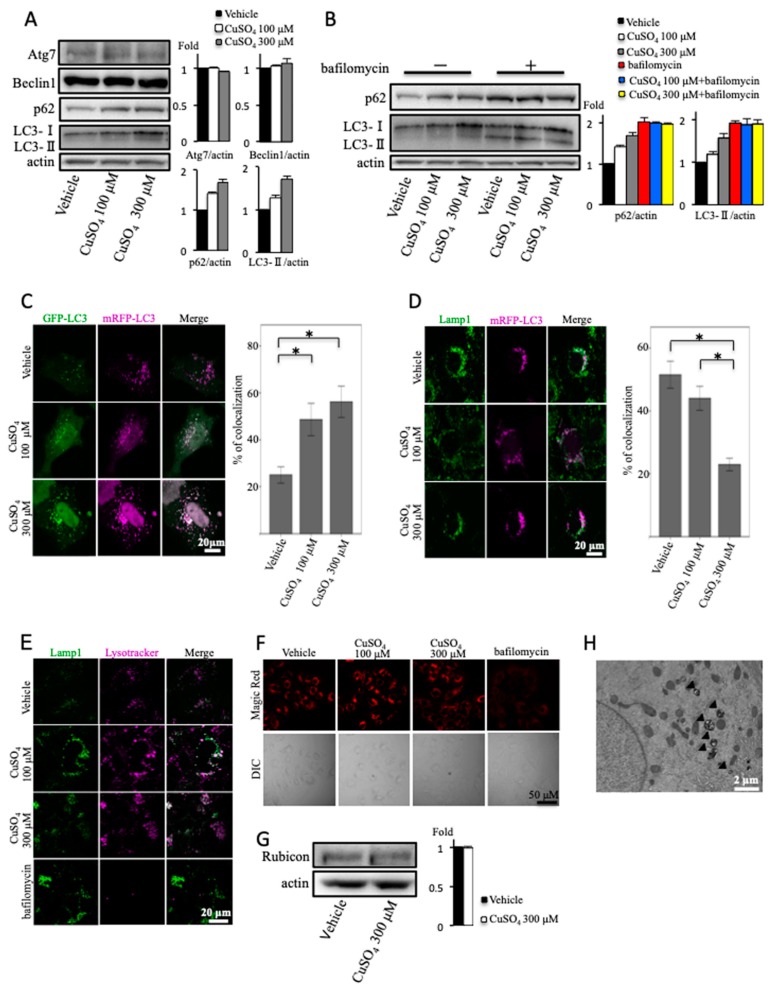
Figure 2.
Effect of copper on autophagy. (A) OUMS-29 cells were treated with copper at concentrations of 100 or 300 μM for 12 h. Densitometry analysis of indicated proteins is shown on the right. (B) Light chain 3 (LC3) turnover assay. OUMS-29 cells were treated with copper at concentrations of 100 or 300 μM for 12 h with or without 50 nM of bafilomycin A1. Densitometry analysis of indicated proteins is shown on the right. (C) OUMS-29 cells were transfected with monomeric red fluorescent protein (mRFP)–green fluorescent protein (GFP) tandem fluorescent-tagged LC3 plasmids, and were treated with copper at concentrations of 100 or 300 μM for 12 h. Colocalizations of mRFP and GFP signals were measured by counting an overall total of 30 to 40 cells over the course of three independent experiments. Colocalization was shown as the percentage of merged signals in the total number of mRFP signals. Data are expressed as means ± SEM. (D) OUMS-29 cells were transfected with mRFP-LC3, and were treated with copper at concentrations of 100 or 300 μM for 12 h. Then, immunofluorescence staining for lysosomal-associated membrane protein 1 (Lamp1) was performed. (E) Effect of copper on lysosomal function. OUMS-29 cells, treated with copper at concentrations of 100 or 300 μM with or without bafilomycin A1 (50 nM) for 12 h, were loaded with 1 μM lysotracker Red for 1 h, followed by fixation, and then immunofluorescence staining for Lamp1 was performed. (F) Effect of copper on lysosomal function. OUMS-29 cells, treated with copper at concentrations of 100 or 300 μM with or without bafilomycin A1 (50 nM) for 12 h, were loaded with Magic Red Cathepsin B reagent for 1 h, and then analyzed by microscopy. (G) Huh7 cells were treated with copper at the concentration of 300 μM for 12 h. Densitometry analysis of indicated proteins is shown on the right. (H) Transmission electron micrograph of a Wilson disease patient. Arrowheads indicate the autophagosomes.

