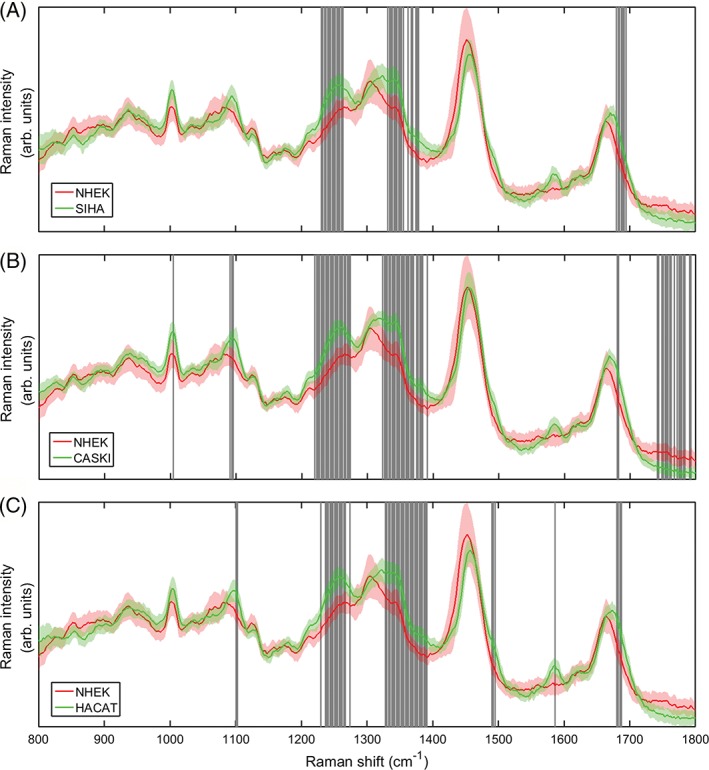
Figure 6.

Direct comparison of the standard spectra for NHEK against the remaining established cell lines SiHa, CaSki and HaCaT. Shaded bands refer to regions of statisitically significant difference (student's . test) between the spectral intensities
