Figure 9.

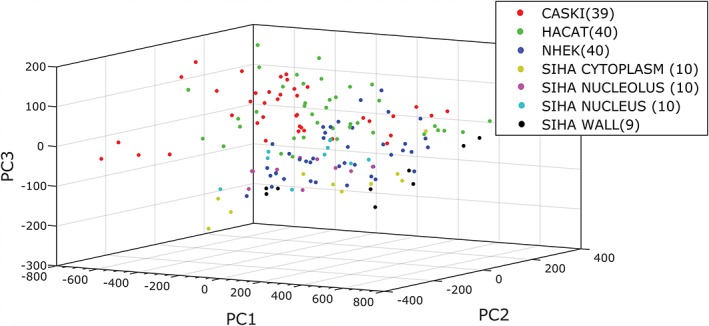
The PCA plot for classification where SiHa cells have been considered in terms of sampling by nucleus, nucleolus, cytoplasm or cell wall. The remaining location‐expanded plots can be found in Appendix S3

The PCA plot for classification where SiHa cells have been considered in terms of sampling by nucleus, nucleolus, cytoplasm or cell wall. The remaining location‐expanded plots can be found in Appendix S3