Figure 2.
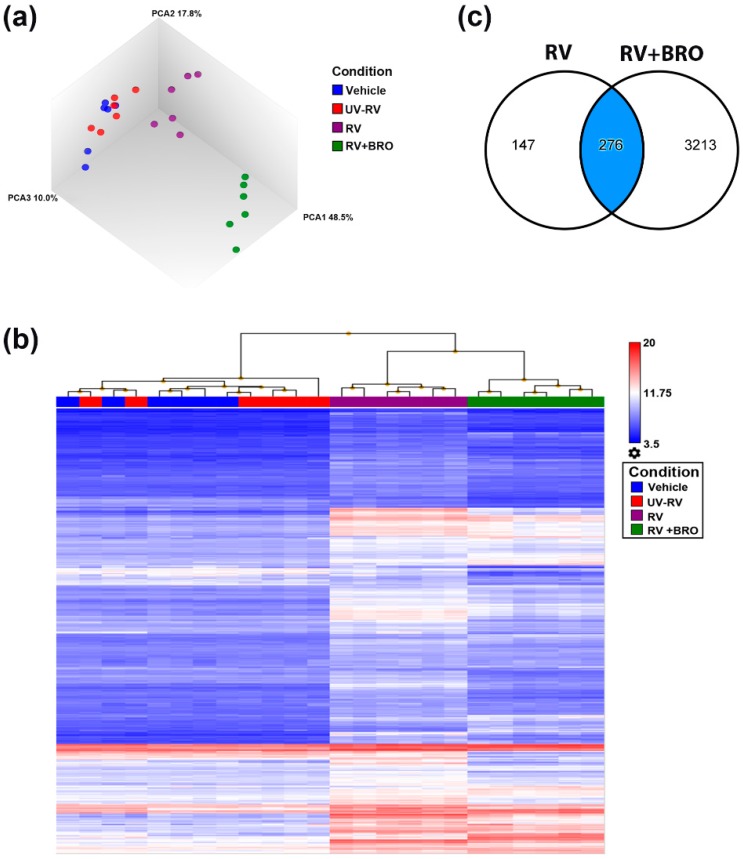
Bioinformatic analyses of whole transcriptome datasets. (a) Principal component analysis (PCA) of transcriptome datasets obtained from mPCLS infected with rhinovirus (RV) or sham-infected with medium or UV-inactivated RV (UV-RV) in the presence of Bronchobini®’s ingredients (BRO) or vehicle control. (b) Heat map of unsupervised hierarchical clustering based on DEGs obtained in RV (both generated using Transcriptome Analysis Console Software TAC 4.0). (c) Venn diagram showing overlap of DEGs by RV and RV+BRO (generated using an ingenuity pathway analysis (IPA) using mapped genes and filter criteria of DEGs at fold change <−2 or >2; ANOVA p-value < 0.05). Vehicle = sham-infected with medium and treated with vehicle, UV-RV = sham-infected with UV-inactivated RV and treated with vehicle, RV = infected with RV and treated with vehicle, RV + BRO = infected with RV and treated with BRO (1:10 dilution).

