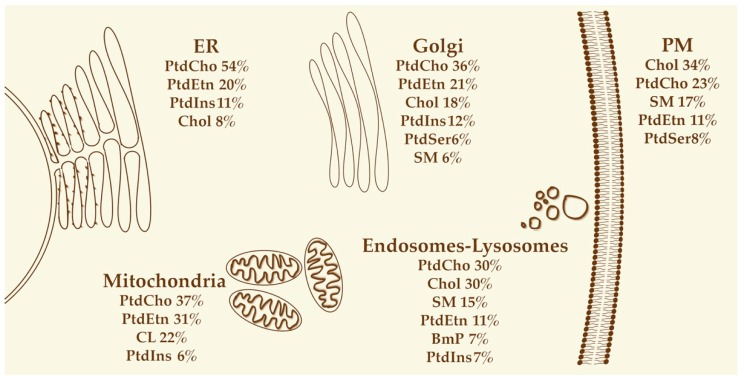
Figure 2.
Lipids in organelle identity. For each organelle, the main lipid components are listed according to their contribution to the total lipid content of the organelle (in percentage, from the most abundant to the least abundant). Only lipids representing at least 5% of the total lipids for each organelle are shown. BmP: bis(monoacylglycero)phosphate; Chol: cholesterol; CL: cardiolipin; PtdCho: phosphatidylcholine; PtdEtn: phosphatidylethanolamine; PtdIns: phosphatidylinositol; PtdSer: phosphatidylserine; SM: sphingomyelin. Not to scale. Adapted from [19].

