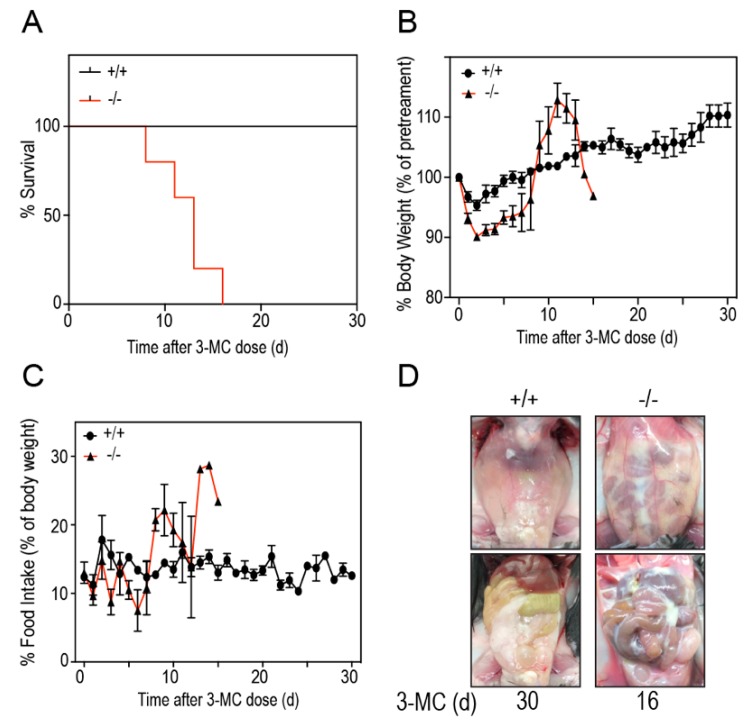
Figure 2.
Thirty-day survival study characteristics. (A) Kaplan–Meier survival curves indicating the survival rate of 3MC-treated WT (+/+) and Tiparp−/− (−/−) mice. Mice were euthanized when body weight loss exceeded 20% of the baseline (day 0) value or if the animal had reached an endpoint as described in the Materials and Methods. (B) Daily body weights expressed as a percent of baseline values (i.e., day 0). (C) Daily food intake measurements expressed as a gram per gram percentage of daily mouse body weight normalized to baseline values. For B and C, the data represent the mean ± SEM; n = 4–6. (D) Representative images of the closed peritoneum and opened peritoneal cavity of WT (left; day 30) and Tiparp−/− mice (right; day 16). Images on the top show an intact peritoneum with fluid accumulation in the 3MC-treated Tiparp−/− mice (right) compared with similarly treated WT mice (left). Images on the bottom show the open abdomen and all tissues in the peritoneal cavity. Reduced epididymal white adipose tissue was observed in the Tiparp−/− mice with remnants of the fluid adhering to the tissues.

